Quarters In My Change Jar
Written 2018-01-01
Tags:Statistics Math
Feasibility
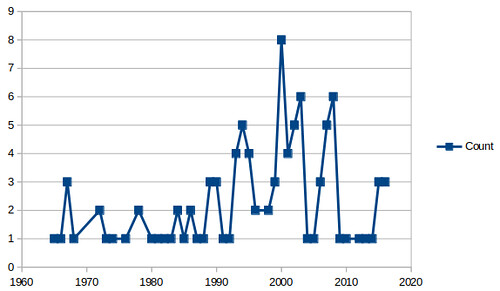
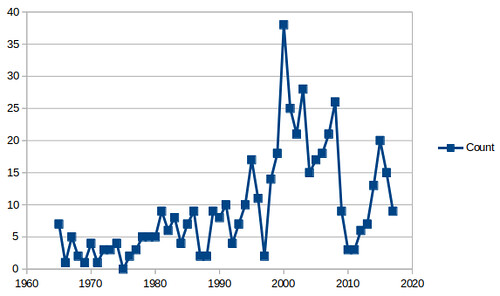
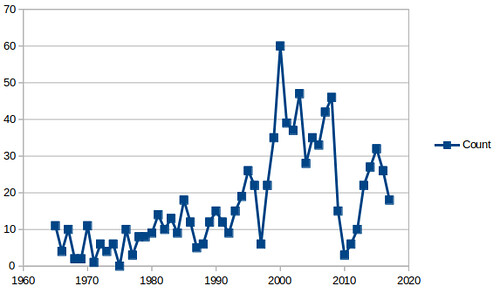
To evaluate the feasibility of an upcoming project, I needed to know the approximate distribution of quarters in circulation in the local area. Upon filling my change jar, I filtered out the quarters and counted them. There were 102 quarters.Trial was repeated 5 days later with 400 quarters from a local bank, then another 400 quarters and results were summed.
By Year
| 102 Quarters | 502 Quarters | 901 Quarters |
 |
 |
 |
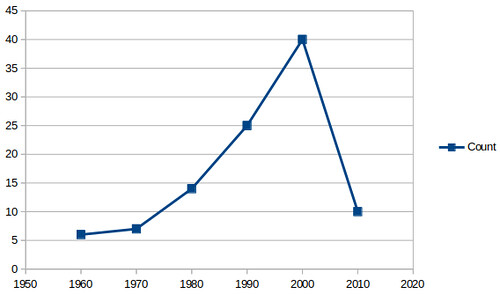
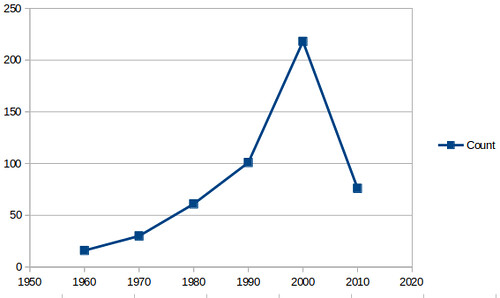
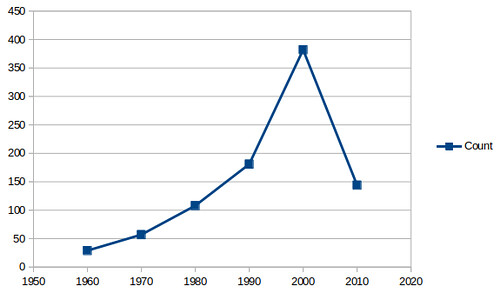
By Decade
| 102 Quarters | 502 Quarters | 901 Quarters |
 |
 |
 |
- Attrition - coins are removed from circulation by loss and damage.
- Inflation - according to cointrackers.com, in 1970 there were 556,393,000 quarters produced. But in 1980 there were 1,157,713,000 quarters produced. Though, this trend is also quite noisy.
- Silver harvesting - 1964 and older quarters are made from 90% silver. This means they are highly likely to be removed from circulation