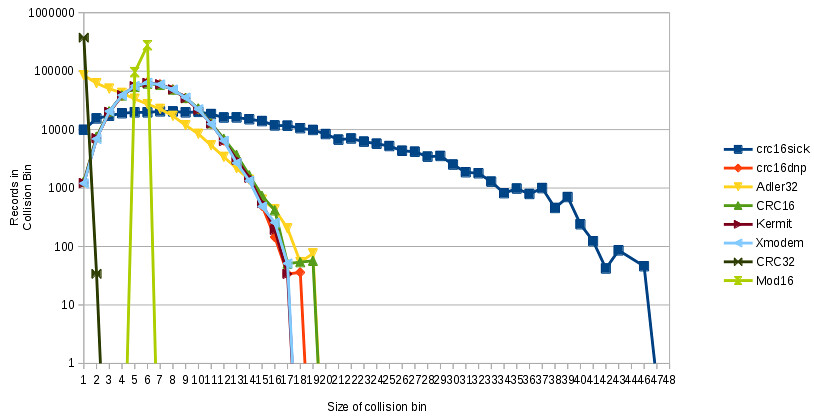
Graphical Analysis of Collision Rates of Various CRCs
Written 2016-02-07
Tags:Checksum CRC16 Math CRC32 CRC Adler32
Introduction
CRCs, or Cyclic-Redundancy-Check, are a simple sort of hash function commonly used to detect accidental changes in data. Recently, I took a few English-language word-lists, and plotted the collision rates of various CRC and related checksum algorithms. Wikipedia lists 48 different CRCs, but this graph will show collision rates of several 16-bit functions and two 32-bit functions.
Purpose of CRCs
CRCs are commonly used for two purposes. They are often used as a redundant(data added without information) few bytes added to a packet to evaluate integrity, but they can also be used as a hash function to give a fixed-length integer value as a summary or index for various-length inputs. Today we will look at them purely as hash functions.Data Set
For today, we will be using a combination of two wordlists, with repetitions filtered out. The file is 3904690 bytes long with 374009 words. The average word is 9.4 letters long. One weakness in this dataset is the lack of long inputs - word lists contain many short records but some functions perform poorly on short records and require a certain minimum input before performing well.How to read the graph
On this graph, collisions are binned into groups. All collisions over the file where exactly three items collided into the same hash slot, are drawn over bin three.
On the X-Axis this graph shows the number of records per collision, and on the Y-Axis it shows how many records were in each collision. So, the number of records in X-collision slot 1 represents the number of records without any collisions, and the number of records in slot 46 shows that there were 46 records in that collision slot for CRC16SICK.
Finally, the Y-Axis of this graph is scaled on a log-curve. This allows us to plot CRC32, which has very few collisions, on the same graph as CRC16SICK, which has many collisions, and make sense of it. On a linear graph, CRC32 would blow everything else out of the scale.
It is also possible to redraw this graph plotting on the Y-Axis the number of times each collision bin was counted - for the same dataset, that graph would have a Y-Axis value of one in slot 46. But, this graph has the advantage that if rendered on a linear graph, the area under each curve would be the same.
