Slightly more refined curve tracing with a power supply and oscilloscope
Written 2021-01-20
Introduction
On my quest to characterize a strange LED, I need a curve-tracer. I don't have one but I do have a power supply and an oscilloscope, the ability to spend large periods of time developing complex solutions to things I could bang out with a few multimeter measurements and a spreadsheet. From XCKD:

Can I generate better IV curves using an oscilloscope for measurement rather than a power-supply?
Equipment
- GW Instek GDS-2102 Oscilloscope - any programmable oscilloscope should do
- GW Instek GPD-3303S Programmable, Isolated Power Supply ( The isolated part is really quite important! )
- A roughly 33 ohm current-limiting resistor - you may wish to select a different resistor based on any estimate of max voltage or current, but in either case measure it(mine was 32.5 ohms).
- A device to test - I used a 6A05 diode to start with.
Test Circuit
Unlike a simple power-supply based measurement directly connected to a bare device under test, we need a current limiting resistor to both convert current to voltage for measurement with the oscilloscope and to increase current measurement resolution above that of the power supply. You could also use a current-probe, but I haven't got one.
A picture is worth a thousand words, but I do not have schematic capture software installed, so:

Effectively, by connecting the oscilloscope ground to both the DUT and resistor, and measuring voltage across both at the same time, we can get closely aligned samples of both voltage across the resistor and across the DUT.
Did I mention you need an isolated power supply? If the power supply's negative terminal is grounded to the same potential as the oscilloscope, the test current will bypass the resistor, drastically increasing the current for each voltage step, possibly destroying the DUT, and likely damaging your oscilloscope probe or worse, your scope too!
Here's what mine looks like:
- On the left of the 6A05 DUT the voltage probe and yellow positive power supply are connected.
- In the middle between DUT and resistor both probes are grounded.
- On the right is the resistor voltage probe and green negative power supply connection.

There is another way to wire this, for a non-isolated power supply, but it requires connecting both oscilloscope grounds to the power supply negative terminal and measuring voltage from both the positive positive terminal and between the DUT and resistor, then doing some subtraction. It probably works fine, but I worried the error might be higher for low voltages. But really, this is still a very, very crude curve-tracer.
Mechanism
This mechanism is slightly different(and better) than the power-supply-only approach from a previous post, yet still quite simple. Set the current limit to a reasonable maximum. For a 6A diode I set mine to 1A since I do not have a diode heatsink but we will not reach this unless there is a short. Decide on a maximum voltage for the top range, but set the voltage limit quite low to start, I used 1mV(but power supply error might be several mV at this range). Decide how much time you are willing to wait for results and how many measurement points you will need over voltage. I used To start, adjust the oscilloscope voltage offsets to center and scale to cover the voltage you will be sweeping. Until the maximum voltage is reached:- Read both voltage channels from the oscilloscope
- Convert the voltage over the resistor to current by flipping the sign and dividing by resistance.
- Save the samples of current through the resistor and voltage over the DUT for later analysis
- Increase the voltage limit slightly
My Setup, for 6A05 Diode
- Power supply voltage up to 3V, 10mV steps, so 300 triggers
- 2x500 oscilloscope points per trigger
- 1ms per division, 10ms sweep
- 10:1 probes(make sure to set on probe and scope)
- DUT Channel(2): 200mV per division, 1V per half-screen, 20MHz bandwidth limiter enabled
- Resistor Channel(1): 500mV per division, 2.5V per half-screen, 20MHz bandwidth limiter enabled
Challenges & Improvements over power-supply-curve-tracer
We've moved many measurements errors from the power supply meter to the oscilloscope. This means we have different errors. Zero-calibration of the oscilloscope is quite important here. Also, any error in resistor measurement will appear as a scaling error in the current conversion. We also have to manage oscilloscope scale with varying voltages present - I didn't even attempt to do so and just set it wide enough - this means that my low-end voltages will impacted more by quantization error(ratio-wise). I did self-calibrate my oscilloscope before running this test. DUT temperature rise is still an issue.Current/Voltage sample synchronization
Since we're using an oscilloscope, the two channels are closely synchronized. There may be a slight AC effect caused by resistance and diode junction capacitance forming a filter, but it's not significant for this diode. This means we can take many more samples without settling delay at each IV point. It's still quite slow compared to a curve-tracer though.Current Resolution
Since we're using a 33ohm resistor, we can vary the power supply voltage by roughly a millivolt each time and step the circuit through no more than a 30 microamp increase.Possible improvement: autoscale
You could automatically adjust the oscilloscope as needed to optimize sample scaling across the varying range of voltages on each channel, since we are effectively using it as a dual-channel meter.Results: Great Big 6A05 Diode, up to 3 volts across circuit, up to almost 0.7 volts across diode, up to about 66mA
While not the diode I want to characterize, this is a big, resilient, 6 amp diode, very resistant to sofware development errors.Scope voltages over time
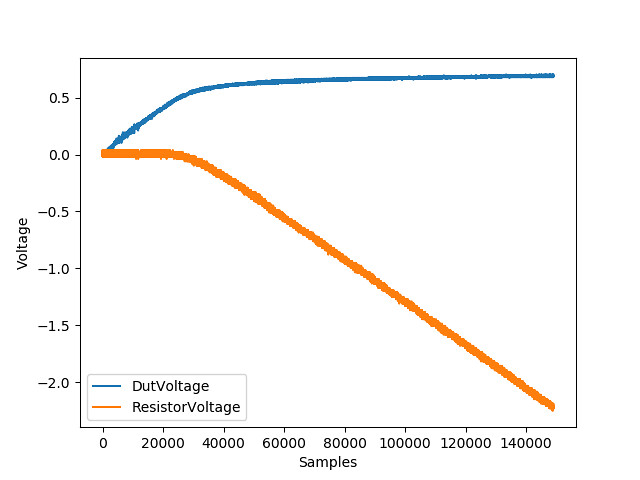
These are the unconverted voltages from a run with the oscilloscope. At this stage we just need to check that neither trace is clipped. We can also use this graph to estimate possible adjustments to oscilloscope resolution.
Voltage and current over Time
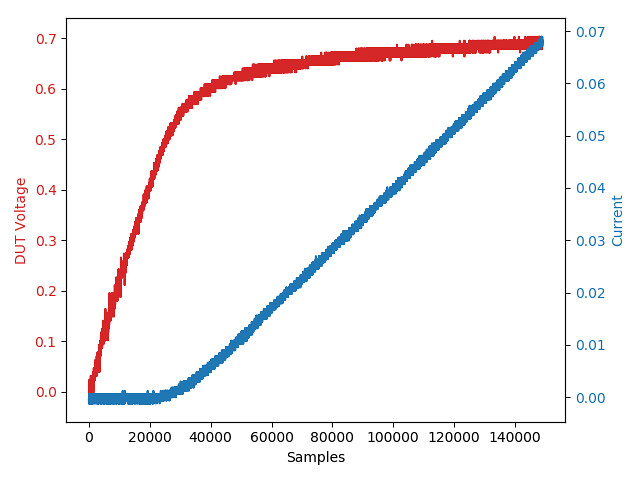
We can clearly see from this plot that the 6A05 starts conducting around sample 25000 when the diode forward voltage starts to be reached near 0.6 volts. Before then, voltage increases without much current increase. After sample 30000, the diode is on, and further increases in drive voltage result in increases in DUT current.
IV Curve
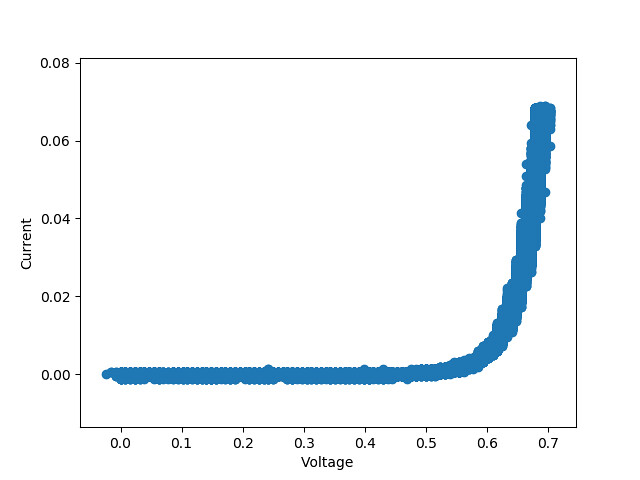
This is what we came here for. For the 6A05, the IV curve is usually only plotted above 10mA and 0.65V, so my trace doesn't overlap enough to compare. I could re-run this over a larget drive voltage range, or use a smaller current measuring resistor, but I think this setup should work for my mystery LED, and I already have a datasheet for the 6A05.
Measurement Error
It should be possible to compute error bars for the oscilloscope measurements, but I have not done so for this graph and it's getting late. The accuracy range of the oscilloscope depends on the actual measurement, the voltage per division settings and a constant base error.Conclusion
Does it work? It works much better than IV curve tracing with just power supply, and I bet it works well enough to characterize my mystery LED. I certainly have fine enough control over current stepping, which was the main issue with using only the power supply.