Latency Measurement, Part 2: Resampler Tuning
Written 2022-03-30
Tags:Video Latency Correlation BarkerCodes CorrelationCodes
One of the challenges with time-aligning correlation codes blinked out by a computer monitor and into a camera is that the sample-rates(FPS) are usually not the same, and even if close, they're slightly different.
On my first pass, my stopwatch started when the frame went out, and stopped when the next frame in decreased in correlation strength(also a frame late). This limits the timing resolution to 1 input frame time. Adding quadratic interpolation to compute the peak correlation strength in between frames helped enormously. Adding an anti-aliasing filter when resampling the correlation code used at the camera helps too.
In the following plot, Lag curve is the old approach, and Lag2 curve include parabolic peak interpolation and resampler filter. Lag1 is roughly 33ms(one input frame time) later/higher than Lag2 because it always picks the first decreasing correlation frame, but Lag2 picks a closer point in time.
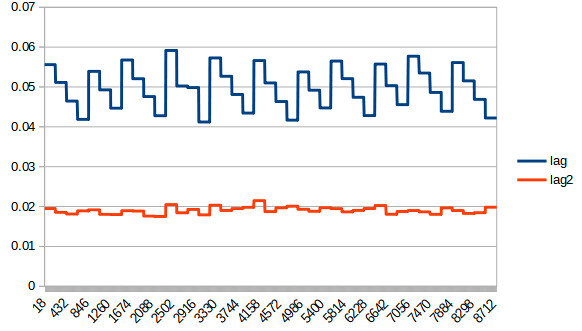
While there is still a significant offset error in the below graph, the variation is down to around 4ms now, which we can see in the following histogram(horizontal scale width same as previous post below).
